Token Usage
Monitor and control your LLM token spend. Track daily costs, set alerts and hard limits, detect anomalies, and receive automated spend reports.
Overview
The Token Usage page gives you full visibility into token costs and the tools to control them proactively. Rather than reacting to unexpected bills, you can set guardrails that notify you or automatically stop agents before costs exceed your thresholds.
Daily Cost Chart
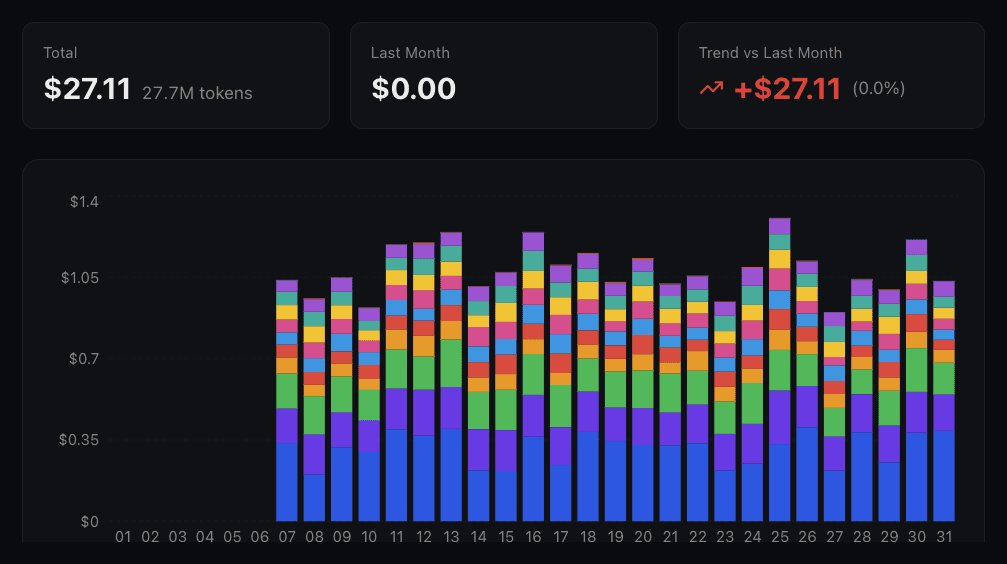
The chart at the top of the Token Usage page shows a stacked bar for each day of the month. Each bar is broken down by agent, so you can see at a glance which agents are driving costs. Judge evaluation tokens are included in each agent's total.
Use the month selector to navigate between months. The chart goes back to the month the project was created.
Summary Cards
Above the chart, three summary cards provide key metrics at a glance:
| Card | Description |
|---|---|
| Current Total | Total token cost for the selected month. For the current month, also shows the projected total based on daily average so far. |
| Trend | Dollar and percentage difference compared to the previous month. Helps you spot whether costs are growing or shrinking. |
| Active Agents | Number of unique agents that had token usage during the selected month. |
Agent Ranking
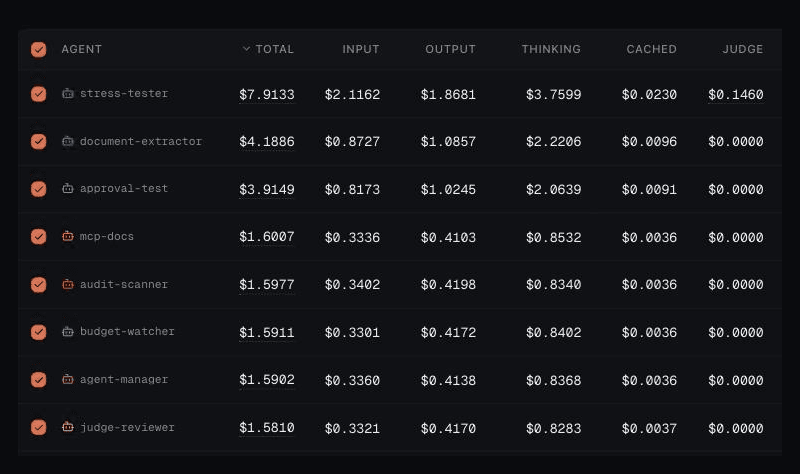
Below the chart, a ranking table shows all agents ordered by total spend for the selected month. The top 5 are shown by default, with an option to expand and see all.
Each agent row includes a full token cost breakdown:
| Column | Description |
|---|---|
| Total Cost | Combined cost across all token categories including judge evaluations. |
| Input | Cost of prompt/input tokens (excluding cached portion). |
| Output | Cost of the model's text response tokens. |
| Thinking | Cost of reasoning/thinking tokens (when enabled). |
| Cached | Cost of cached input tokens (billed at reduced provider rate). |
| Judge | Cost of judge evaluation runs associated with this agent. |
Spend Alerts & Limits
Spend alerts and limits let you define thresholds that trigger actions when crossed. Each entry has a type, scope, period, and threshold amount in EUR.
Alert vs. Limit
Scope
Each alert or limit can be scoped to control exactly what it applies to:
| Scope | Behavior |
|---|---|
| Global | Applies to all token spend across the entire project. When a global limit is hit, all agent runs are paused. |
| Environment | Applies to one or more specific environments. When hit, only runs in those environments are affected. Useful for separating production and staging budgets. |
| Agent | Applies to one or more specific agents by name. When hit, only those agents are paused. All other agents continue normally. |
Period
Choose whether the threshold resets daily or monthly:
- Monthly: Spend is accumulated from the 1st of the month. Resets on the 1st of the next month.
- Daily: Spend resets at midnight UTC each day.
Progress Tracking
Each alert and limit shows a visual progress bar indicating how much of the threshold has been consumed. The bar changes color as spend approaches the limit: default at low usage, amber when nearing the threshold, and red when exceeded.
Cost Anomaly Detection
When enabled, Connic automatically monitors the cost of each completed agent run and compares it against that agent's 30-day rolling average. If a run costs significantly more than normal, an alert is sent.
Configuration
| Setting | Description |
|---|---|
| Enabled | Toggle anomaly detection on or off for the project. |
| Multiplier | The threshold multiplier. Default is 3x, meaning a run is flagged if it costs more than 3 times the rolling average. Adjust higher to reduce noise or lower for tighter monitoring. |
Spend Reports
Automated email reports summarize token costs over a given period. Two report types are available:
Enable or disable each report type from the Token Usage page. Delivery preferences (which team members receive the email) can be managed in Settings > Notifications, where spend reports appear as dedicated notification types.
Notification Settings
Budget-related events are integrated into the project notification system. Each team member can independently control which budget notifications they receive and through which channel.
| Event Type | In-App | Description | |
|---|---|---|---|
| Budget Alert Triggered | Yes | Yes | A spend alert threshold was crossed. |
| Budget Limit Triggered | Yes | Yes | A hard limit was hit and agents are being paused. |
| Cost Anomaly Detected | Yes | Yes | An agent run cost significantly exceeded its rolling average. |
| Weekly Spend Report | Yes | N/A | Email-only weekly cost summary. |
| Monthly Spend Report | Yes | N/A | Email-only monthly cost summary. |
All notification preferences are managed under Settings > Notifications. Spend reports are email-only and do not appear in the in-app notification feed.
How Costs Are Calculated
Token costs are estimated using the model pricing configured in your project. Connic matches each run's model name against your pricing rules (project-specific exact match, then regex, then global exact, then global regex) and applies the per-million-token rates with volume tiering if configured.
The four token categories (input, output, thinking, cached input) are priced independently. Cached input tokens are a subset of input tokens and are charged at the reduced cached rate instead of the full input rate.