Observability
Monitor agent performance, inspect execution traces, analyze token usage, and build custom dashboards to debug and optimize your agents.
Overview
Every agent execution in Connic is recorded as a run. Each run captures the full lifecycle of a request: the input that triggered it, every intermediate step the agent took, the final output, token consumption, cost estimates, and timing data. Connic provides three layers of observability to help you understand and debug your agents:
Run Logs
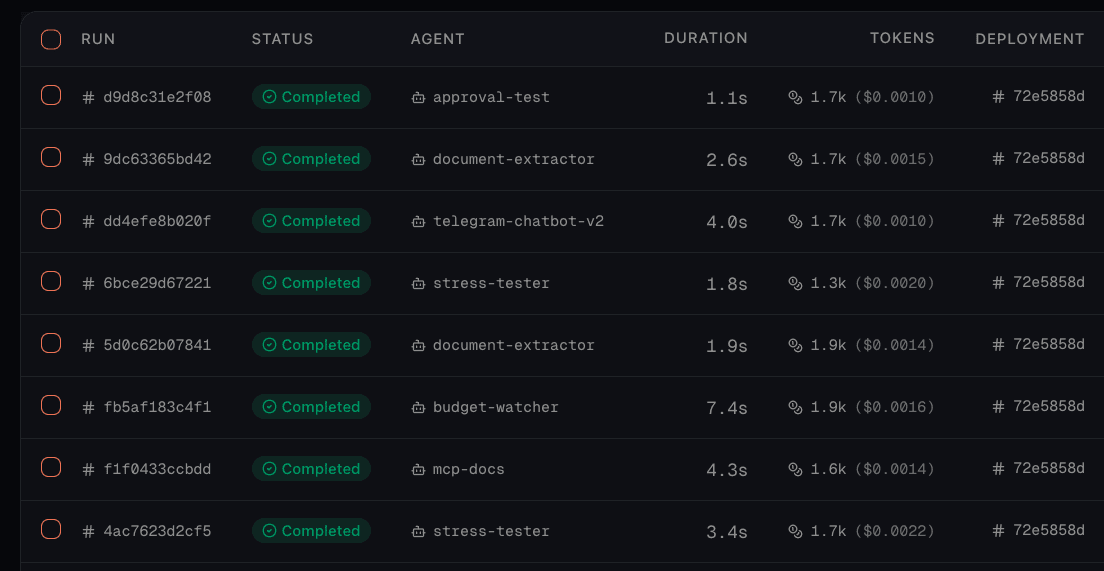
The Logs tab in your project shows a chronological list of all agent runs. Each row displays the run status, agent name, deployment, duration, token count with estimated cost, and when it was queued. The table updates every few seconds.
Filtering Runs
Use the filter bar at the top to narrow down runs:
| Filter | Description |
|---|---|
| Status | Filter by one or more statuses: queued running completed failed cancelled |
| Date Range | Select a time window using presets (24h, 7d, 30d) or a custom date range |
| Deployment | Show runs from a specific deployment only |
| Search | Free-text search across run content. Use key=value syntax to search by context values (e.g. customer_id=abc123) |
key=value search syntax queries against the run context. This is useful if your middleware stores metadata like user IDs, session IDs, or request identifiers. You can then search for all runs associated with a specific user or session.Inspecting a Run
Click any run in the logs table to open its detail view. The run detail provides the full picture of what happened during that execution.
Run Header
The header shows the run ID, status badge, and key metadata at a glance:
- Connector: Which connector triggered this run (with a link to the connector)
- Triggered by: If another agent triggered this run, a link to that parent run
- Duration: Total execution time (live-updating for in-progress runs)
- Token usage: Total tokens consumed, with a tooltip showing the full breakdown and estimated cost
Run Sections
You can also re-run any execution from the run detail view. This triggers the same agent with the same input, letting you verify that a fix resolved the issue. For queued or running runs, a cancel button is available.
Execution Traces
Execution traces provide a step-by-step breakdown of everything that happened during a run. Connic captures traces using OpenTelemetry spans, organized in a hierarchical tree structure. Each span represents a discrete operation: an LLM call, a tool invocation, a middleware hook, or a sub-agent execution.
Span Types
Each span in the trace tree has a type icon and color to help you quickly identify what it represents:
| Icon | Span Type | What It Represents |
|---|---|---|
| LLM | A call to the language model. Contains the prompt (input), the model's response (output), and reasoning (thoughts) if enabled. | |
| Tool | A tool function invocation. Shows the arguments passed to the tool and its return value. | |
| MCP Tool | A tool call to an external MCP server. Includes the server name, tool name, arguments, and response. | |
| Middleware | A middleware hook execution (before or after). Shows the data flowing through the middleware. | |
| Sequential | A sequential agent orchestration step. Contains child spans for each agent in the chain. | |
| Run / Step | The top-level run or an individual iteration in the agent loop. |
Reading a Trace
Traces are displayed as an indented tree. The top-level span represents the entire run, and child spans are nested below showing the execution order. For each span you can see:
- Status: Whether the span completed successfully (ok) or encountered an error (error)
- Duration: How long this step took in milliseconds
- Inputs: The data passed into this step (expandable)
- Outputs: The data returned by this step (expandable)
- Thoughts: The model's internal reasoning, displayed with a distinct dashed border. Present on LLM spans whenever the provider returns thinking content — set
reasoning_efforton the agent configuration to control how much. - Metadata: Additional context such as the model name, retry count, or tool error details (expandable)
Trace Example
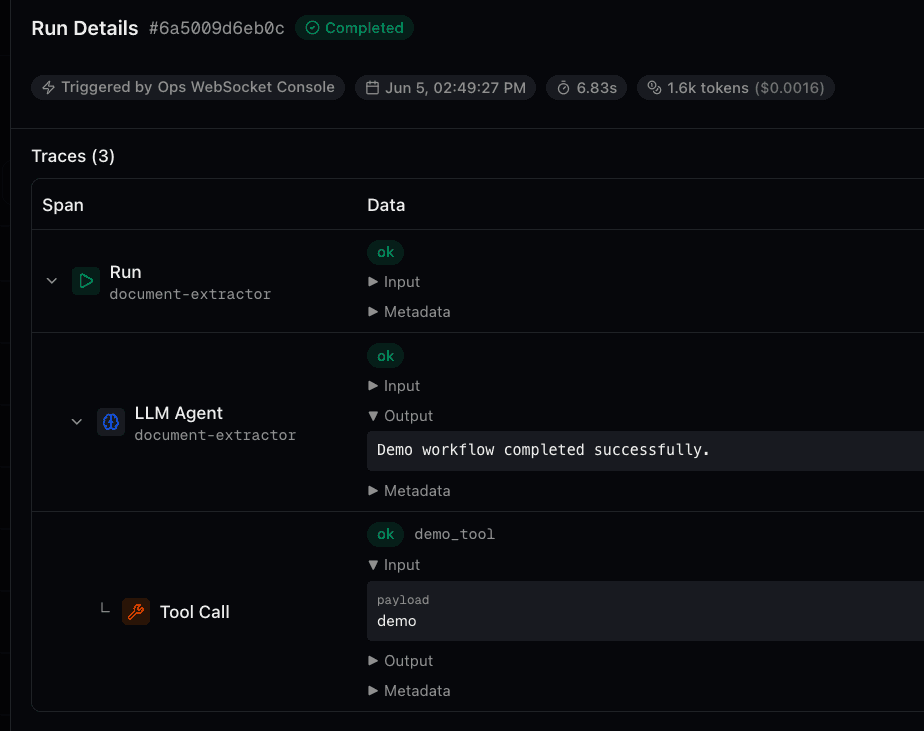
Here is what a typical LLM agent trace looks like when the model uses a tool:
In this trace, the agent received a request, passed through the before middleware, made an LLM call that decided to use the calculator.add tool, then made a second LLM call to formulate the final response using the tool result, and finished with the after middleware.
Token Usage & Cost
Every run records detailed token consumption broken down into four categories. Understanding these categories helps you optimize cost and identify unexpected behavior.
| Category | Description |
|---|---|
| Input Tokens | Tokens in the prompt sent to the model, including the system prompt, conversation history, and tool definitions. This is typically the largest category. |
| Output Tokens | Tokens in the model's text response. Does not include reasoning tokens. |
| Thinking Tokens | Tokens used by the model's internal reasoning process. Present when reasoning_effort is set above off and the provider returns thoughts. Controlled by reasoning_effort / reasoning_budget. |
| Cached Input | Portion of input tokens served from the provider's cache (a subset of input tokens, not additional). Cached tokens are typically billed at a reduced rate. |
Token counts and estimated costs are visible in multiple places:
- The runs table shows total tokens and estimated cost per run
- The run detail header shows total tokens with a tooltip breaking down all four categories plus cost
- The agent detail page shows aggregate token usage for that agent
- Observability dashboards provide token charts and stat cards with configurable breakdowns
Custom Dashboards
The Observability tab in your project provides customizable dashboards for monitoring agent performance over time. You can create multiple dashboards, each with a mix of widget types arranged in a drag-and-drop grid.
Widget Types
Dashboard Features
- Multiple dashboards: Create separate dashboards for different concerns (e.g. one for cost monitoring, one for error tracking)
- Date range picker: Adjust the time window globally for all widgets with presets or custom ranges
- Auto-refresh: Dashboards poll for new data every 10 seconds
- Per-widget filters: Scope any widget to specific agents or connectors
- Shared input variables: Add input widgets once and reference their values across charts, stat cards, and logs
- Drag-and-drop layout: Arrange and resize widgets freely in edit mode
- Default dashboard: A pre-configured dashboard is created automatically for new projects
Logging from Custom Code
Anything you print or log from inside a tool, middleware, hook, or guardrail is captured per run and shown in two places: the Logs tab in your project (filterable by level and source across all runs) and the run detail view (scoped to that single run). You don't need to import a Connic-specific logger. Connic attaches to Python's stdout, stderr, and the standard logging module for you.
What gets captured
| You write | Shown as |
|---|---|
| print("hello") | Log line at info level |
| print("boom", file=sys.stderr) | Log line at error level |
| logging.getLogger("tools.x").info(...) | Log line at the exact debug / info / warning / error level you called |
For the stdlib logging module to be captured, the logger name must start with tools., middleware., hooks., or guardrails.. The common idiom logging.getLogger(__name__) already produces names like that because Connic imports your files under those package roots. Loggers with other names are ignored by the dashboard.
Source labels
Each log line is tagged with a source so you can filter it on the Logs tab. The source reflects where the code ran:
| Source | Produced by |
|---|---|
| Tool | A custom tool, tagged with the tool name |
| Middleware | Middleware before() and after(), tagged before / after |
| Hook | A tool hook, tagged with the tool name it wraps |
| Guardrail | A custom guardrail, tagged with the guardrail name |
Example
"""A custom tool that emits logs Connic will surface in the dashboard."""
import logging
import sys
from typing import Any, Dict

log = logging.getLogger(__name__)  # -> "tools.lookup_customer"

async def lookup_customer(args: Dict[str, Any], context: Dict[str, Any]) -> Dict[str, Any]:
    customer_id = args["customer_id"]

    # Plain print -> captured as an info-level log line
    print(f"Looking up customer {customer_id}")

    # stdlib logging -> captured at the level you called
    log.warning("cache miss for %s", customer_id)

    try:
        record = await fetch_from_crm(customer_id)
    except Exception:
        # Writes to stderr -> captured as an error-level log line
        print(f"CRM lookup failed for {customer_id}", file=sys.stderr)
        raise

    return record
This run produces three log entries, all tagged with source tool.lookup_customer: one info from the print, one warning from the stdlib logger, and one error from the stderr write. They appear on the project Logs tab and in the run detail view in the order they were emitted.
- Up to 500 log lines are retained per run; anything beyond that is dropped silently.
- Unhandled exceptions from tools, middleware, hooks, and guardrails are auto-logged with the full traceback at error level, tagged with the same source as the code that raised. The exception still propagates, so the run will also fail (for tools/middleware/hooks) and show in the run detail's error banner. Control-flow exceptions
StopProcessingandAbortToolare not logged as errors because they're intentional. - If you catch an exception and want the traceback in Logs anyway, call
logging.exception(...)inside theexceptblock. The handler includesexc_infowhen present. - Log lines are flushed on newlines. A
printwithout a trailing newline may be buffered until the next newline or until the tool/middleware returns. - There's no Connic logger helper to import. The stdlib is the API. If you prefer structured logs, call
json.dumps(...)and log the string.
Agent-Level Observability
Each agent has its own detail page accessible from the Agents tab. This provides a focused view of that agent's performance:
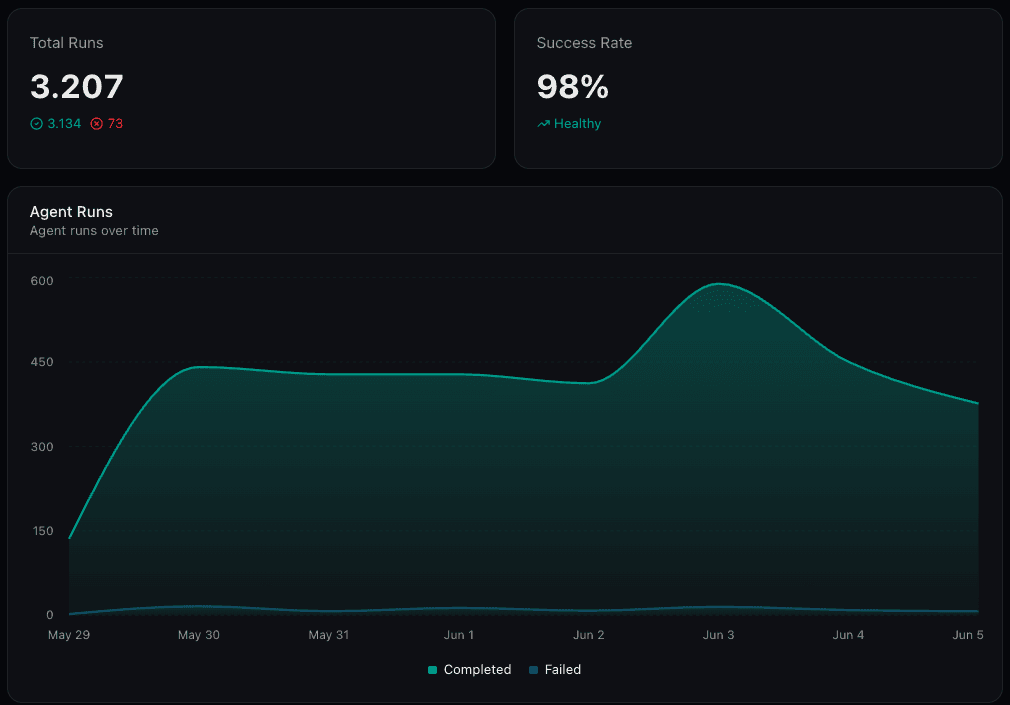
- Statistics: Total runs, success rate with trend indicator, average duration, and total tokens used
- Status breakdown: Counts for completed, failed, running, and queued runs
- Configuration: Agent type, model, max concurrent runs, and linked tools or agents
- Run history: An agent-scoped runs table with the same filtering capabilities as the main logs page
- Manual trigger: Send a test payload to the agent directly from the dashboard
Debugging an Agent
When an agent occasionally produces incorrect results, the goal is to narrow the issue to a specific slice of runs, compare a bad run against a similar good run, and identify the first step where the execution diverges. In Connic, the fastest workflow is to isolate the pattern in Logs, compare traces side by side, inspect the decision path in LLM and tool spans, then use token patterns to confirm the likely cause.
Intermittent issues are much easier to debug when your middleware tags runs with stable context keys such as customer_id, request_type, plan, locale, or workflow_version. You can then use key=value search in Logs to isolate only the runs that matter.
from typing import Any, Dict

async def before(content: Dict[str, Any], context: Dict[str, Any]) -> Dict[str, Any]:
    payload = context.get("payload", {})
    context["request_type"] = "invoice_validation"
    context["customer_tier"] = payload.get("customer_tier", "unknown")
    context["workflow_version"] = "2026-03-debug-pass"
    context["debug_bucket"] = "high-risk"
return contentIsolate the Failing Pattern
Start in Logs and narrow to the agent in question. If the issue produces outright failures, filter by failed status. If the agent completes but returns wrong results, use search plus context filters to isolate the bad slice of runs: for example customer_id=abc123, request_type=refund, or workflow_version=2026-03-debug-pass. This helps you determine whether the problem is tied to a specific customer segment, input shape, deployment, or recent prompt/tool change.
Compare Like-for-Like Runs
Open one incorrect run and one healthy run side by side. Pick runs from the same agent, the same deployment, and as similar a context slice as possible. First compare the inputs and run context to confirm you're looking at like-for-like executions. Then compare the traces and look for the first span where the runs diverge. That first divergence usually points to the real source of the issue faster than inspecting the final output.
Inspect the Decision Path
If the first divergence happens in an LLM span and your agent has reasoning_effort set above off, expand the Thoughts section to see how the model interpreted the request. This often reveals missing context, incorrect assumptions, or a prompt that is too vague. If the first divergence appears in a middleware or tool span instead, inspect that step first. Bad enrichment, stale upstream data, or malformed tool arguments often surface as model errors much later in the run.
- LLM span chose the wrong tool or passed incorrect arguments: the issue is likely in the system prompt or tool descriptions. The model didn't have enough guidance to make the right call.
- Tool span returned empty or unexpected data: the issue is upstream of the model. Check the tool itself: stale data, an API error, or the model passed arguments the tool couldn't handle.
- More LLM iterations than similar successful runs: the agent may be looping because a tool consistently returns unsatisfying results, or the system prompt doesn't define a clear stopping condition.
Use Token Patterns as Clues
Compare token usage between passing and failing runs. The token breakdown often explains why a run went off course even when the final output looks superficially similar.
| Signal | What It Suggests |
|---|---|
| High input tokens | The prompt or middleware-added context may be bloated, making the model pay less attention to the most relevant details. |
| Thinking tokens hit the budget | If thinking tokens repeatedly land at reasoning_budget, the model may be cutting its reasoning short on harder cases. |
| Very low or zero thinking tokens | The model may not be spending enough reasoning effort on requests that require multi-step analysis. |
| Trace reaches max iterations | The agent is stopping because of max_iterations, not because it actually finished the task. |
| Failing runs use far more tokens | The agent may be wandering, retrying, or compensating for unclear instructions, weak tool outputs, or noisy context. |
Verify Tool Inputs and Outputs
Expand tool spans and inspect both the arguments the model sent and the data the tool returned. Intermittent wrong answers often come from tools that return empty results, stale data, or technically valid data in an unexpected shape. If the passing run and failing run call the same tool with different arguments, the issue is usually in the model's decision-making. If the arguments match but the outputs differ, the issue is usually upstream of the model.
Re-run to Verify Fixes
After adjusting your prompt, middleware, tool behavior, or agent configuration, use Run Again on the original failing run. This lets you verify the fix against the exact scenario that failed, then compare the new trace against the original to confirm that the execution path is now behaving as expected.
Configuration for Better Observability
These agent configuration options directly impact what data is captured in traces:
| Setting | Impact on Observability |
|---|---|
| reasoning_effort | Set above off (minimal/low/medium/high/xhigh) to capture the model's thinking process in trace spans. Essential for understanding why the model made a decision, not just what it output. |
| reasoning_budget | Controls how many tokens the model can use for reasoning. If traces show truncated thoughts, increase this value. Set to -1 to let the model decide. |
| max_iterations | Limits agent loop iterations. If a failing run's trace shows exactly this many iterations, the agent was forced to stop. Consider increasing the limit or refining the prompt to reduce unnecessary iterations. |
| middleware context | Values set in middleware context are saved with the run and searchable via key=value search. Tag runs with user IDs, session IDs, or request types to make debugging easier. |
Accessing Run Data in Code
The middleware after() hook is the way to programmatically access run data such as token usage and duration. The context dict passed to after() includes system fields that are populated when the agent finishes:
| Context Key | Description |
|---|---|
| run_id | Unique identifier for this run |
| agent_name | Name of the agent that executed |
| duration_ms | Execution time in milliseconds, excluding approval wait time |
| token_usage | Dict with input_tokens, output_tokens, thinking_tokens, cached_input_tokens, and total_tokens |
Use these fields to send run data to your own monitoring or analytics system:
import httpx
from typing import Any, Dict

async def after(response: str, context: Dict[str, Any]) -> str:
    """Send run metadata to an external monitoring system."""
    try:
        async with httpx.AsyncClient() as client:
            await client.post(
                "https://monitoring.internal/events",
                json={
                    "run_id": context.get("run_id"),
                    "agent": context.get("agent_name"),
                    "duration_ms": context.get("duration_ms"),
                    "tokens": context.get("token_usage", {}),
                    "request_type": context.get("request_type"),
                }
            )
    except Exception:
        pass
return responsebefore() are also available in after(), so you can include context like request_type or customer_id in your monitoring payloads. See the Context documentation for the full reference.