
Runs & Traces
Runs show agent inputs, outputs, context, and execution traces. Sequential steps appear as linked child runs with their own traces.
On this page
Agent Runs
The Agent Runs tab in a project shows a chronological list of all agent runs. Each row displays the run status, agent name, deployment, duration, token count with token cost, and when it was queued. The table updates every few seconds.
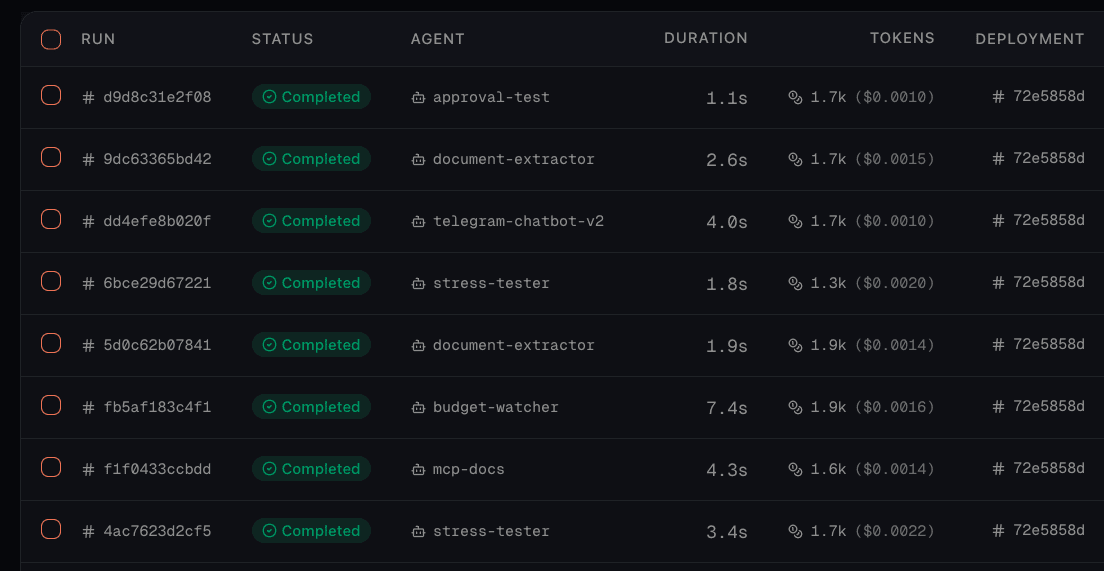
Filtering Runs
Use the filter bar at the top to narrow down runs:
| Filter | Description |
|---|---|
| Status | Filter by one or more statuses: scheduled queued running awaiting approval completed failed blocked cancelled |
| Date Range | Select a preset such as 24h, 7d, or 30d, or choose a custom range. |
| Deployment | Show only runs from a specific deployment. |
| Search | Search run content, or filter with an expression such as context.customer == 'acme'. The sparkle button turns a plain-language request into a filter. |
input.amount >= 40), and the agent output (output.priority == 'high'), and can be combined with and, or, and not. Store stable metadata such as user IDs, session IDs, request types, or workflows in middleware to isolate related runs. The question-mark icon in the search field lists the full syntax.Inspecting a Run
Click a row in the runs table to open its detail view. The detail page combines run metadata, request and response data, context, and the execution trace.
Run Header
- Run ID and status: identify the execution and whether it completed, failed, or is still in progress.
- Connector: see which connector triggered the run.
- Triggered by: follow the parent-run link when another agent started this execution.
- Duration: inspect elapsed execution time, updated live for in-progress runs. Completed runs exclude recorded approval waits and sequential child-run waits from their duration.
- Token usage: open the tooltip for the token breakdown and token cost.
Run Sections
Use Run Again to trigger the same agent with the same input. Scheduled, queued, and running executions also provide a cancel action.
Deleting Runs
To delete a completed run, click the trash icon next to the close button in its detail drawer. To delete several runs, select their rows in the runs table and click the delete action. Both actions ask for confirmation. Deletion is available after the selected runs and their background processing have finished, and requires the Delete runs project permission.
Deletion is permanent. Log retention deletes runs automatically after the configured period.
Execution Traces
A trace breaks a run into a hierarchical tree of spans. Each span represents one operation, such as an LLM call, tool invocation, middleware hook, or link to a triggered agent's separate run.
Span Types
| Icon | Span Type | What It Represents |
|---|---|---|
| LLM | A logical language-model step with its prompt, response, and reasoning when available. | |
| LLM Call | A physical provider request. Retries appear as subsequent requests with backoff details in metadata. | |
| Tool | A tool invocation with the arguments it received and the value it returned. | |
| MCP Tool | A call to an external MCP server, including the server, tool, arguments, and response. | |
| Middleware | A before, after, or cleanup middleware hook and the data flowing through it. | |
| Connector | The inbound connector that started the run, followed by a grouped record of every outbound connector delivery. | |
| Triggered Agent | A call to another agent. Each sequential step is persisted as a separate child run and linked from this span. | |
| Run / Step | The top-level run or one iteration of the agent loop. |
Traces also label tool discovery, context or conversation compression, guardrail groups and results, approval decisions, and tool agents.
Reading a Trace
Child spans are indented beneath the operation that created them. For each span, inspect its status, duration, inputs, outputs, and metadata. LLM spans can also include Thoughts when the provider returns reasoning content; configure that behavior with reasoning_effort in agent configuration.
- Status: whether the span finished successfully or encountered an error.
- Duration: how long the operation took.
- Inputs and outputs: the data that entered and left the step.
- Metadata: model names, retry counts, and tool error details.
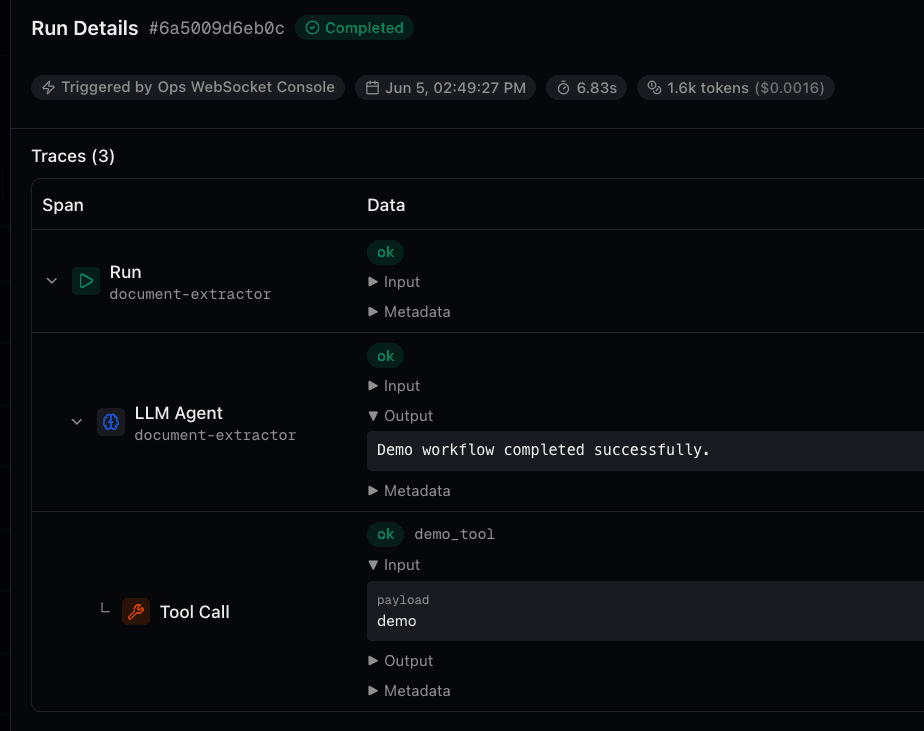
Trace Example
Here the request passes through before middleware, the model chooses calculator.add, the model turns the tool result into a final answer, and after middleware completes the run.