
Dashboards
Custom dashboards combine metrics, charts, filters, and activity feeds for agent runs, reliability, judge scores, token usage, and costs over time.
On this page
Custom Dashboards
The Dashboards section of the project sidebar provides customizable dashboards for monitoring agent performance over time. All Dashboards lists every dashboard, and pinned dashboards appear directly below it. Create multiple dashboards and arrange their widgets in a drag-and-drop grid so each view answers one operational question.
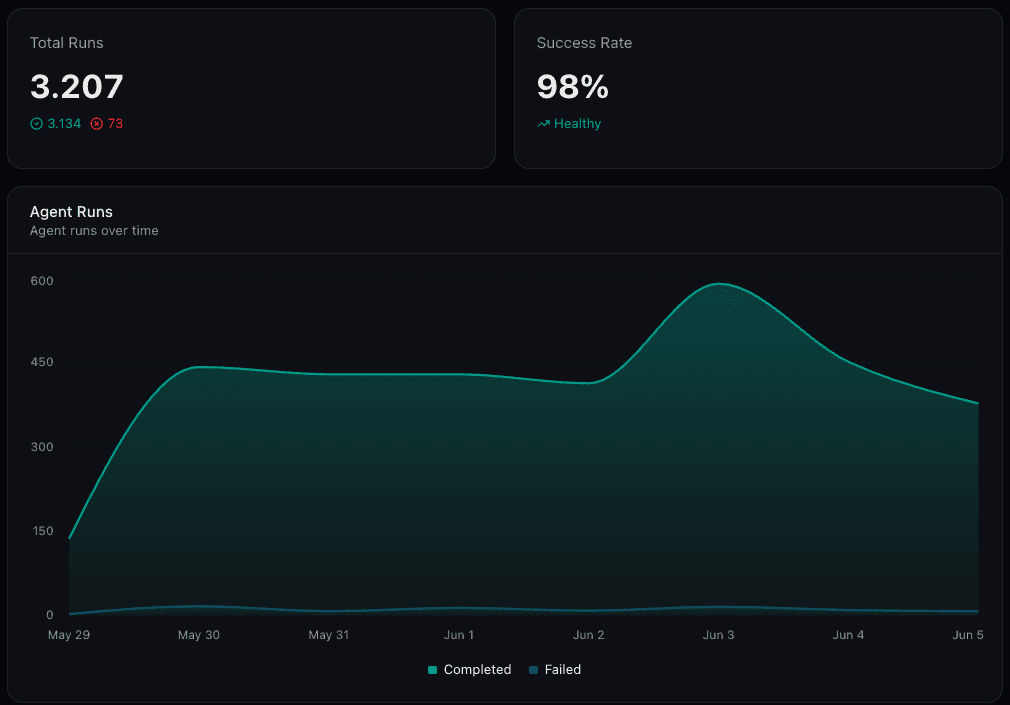
Widget Types
Cost by Customer or Use Case
Any key that middleware or tools write to the run context can group token cost. Set context["customer_id"] or context["use_case"] in middleware, then add a Bar Chart with By Context, enter the key, and choose Token Cost or Token Usage. The chart ranks up to 20 values for the selected date range and environment.
To follow one value over time, add an Area Chart or Stat Card with a filter such as context.customer_id == 'acme'. To use one dashboard for every customer, add an Input Widget with the variable customer and set the filter to context.customer_id == '{customer}'. An empty input removes that condition.
Dashboard Features
- Multiple dashboards: separate cost monitoring, reliability, and debugging views.
- Date range picker: change the time window for every widget with a preset or custom range.
- Auto-refresh: refresh live ranges every 10, 30, or 60 seconds according to the selected range; fixed past ranges do not refresh.
- Per-widget filters: scope a widget to particular agents or connectors.
- Shared input variables: define one input and reuse its value across charts, stats, and logs.
- Drag-and-drop layout: arrange and resize widgets in edit mode.
- AI editing: add or revise widgets from a plain-language dashboard prompt.
- Default dashboard: use the preconfigured dashboard included in each project.
Agent-Level Observability
Open an agent from the Agents tab for a focused operational view. It combines that agent's configuration and recent executions without requiring a custom dashboard.
- Statistics: total runs, success rate, total runtime, token cost, and tokens, with average, p50, and p95 per-run views.
- Configuration: agent type, model, concurrency, and linked tools or agents.
- Runs table: an agent-scoped table with status, context, guardrail, deployment, and date filters.
- Manual trigger: send a payload to the agent directly from the dashboard.