You deployed your first AI agent. It processed 500 requests yesterday. Great news, right? Except you don't know how many tokens it consumed, what it cost you, or why 12% of those requests failed silently. Welcome to the observability problem.
Traditional APM tools were built for request-response patterns: latency percentiles, error rates, throughput. AI agents don't fit that mold. They make multiple LLM calls per request, token usage varies wildly based on context, and costs can spike 10x when users send longer inputs. You need observability built specifically for agentic workloads.
What Makes Agent Observability Different
When a user sends a message to your agent, a lot happens behind the scenes. The agent might:
- 1.Query a knowledge base for context (RAG retrieval)
- 2.Make an initial LLM call to reason about the request
- 3.Execute 2-3 tool calls (API requests, database queries)
- 4.Make another LLM call to synthesize results
- 5.Optionally call another agent for specialized tasks
Each step consumes tokens, and each step can fail. Traditional metrics like "average response time" hide all that. You need granular visibility into each phase.
Per-step traces, token usage, and cost-per-run come built in, so you can debug and price every agent run.
Get started freeThe Four Pillars of Agent Observability
Building Your First Dashboard
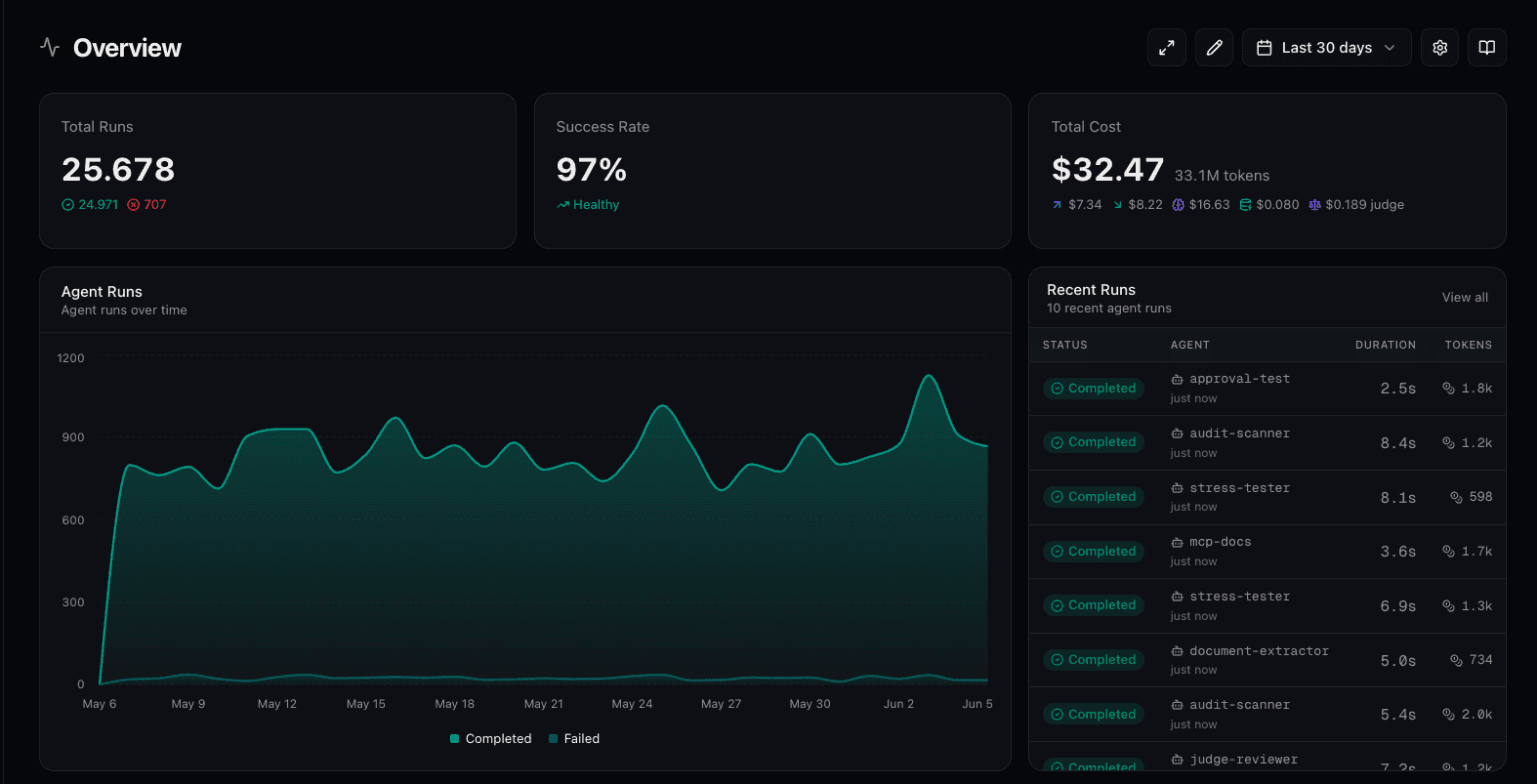
Connic creates a default dashboard when you start your first project, but the real value comes from customizing it. Here's how to build a dashboard for what you actually look at:
Step 1: Navigate to Observability
In your project sidebar, click Observability. You'll see the default dashboard with pre-configured widgets for total runs, success rate, token usage, and costs.
Step 2: Enter Edit Mode
Click the Edit button in the top right. This unlocks drag-and-drop arrangement and the ability to add, remove, or configure widgets.
Step 3: Add Widgets
Click Add Widget to choose from three widget types:
Stat Cards
Single metric displays. Choose from: Total Runs, Success Rate, Failed Runs, Tool Calls, Total Tokens, Input/Output Tokens, Total Cost, Input/Output Cost, Avg Cost per Run, Avg Tokens per Run.
Area Charts
Time-series visualizations. Track agent runs (completed vs failed), token usage (input vs output over time), or token cost trends.
Logs Lists
Recent activity feeds. Show agent runs or connector runs with status, duration, and direct links to detailed traces.
Step 4: Filter by Agent
Most widgets support filtering by agent. If you run multiple agents for different purposes, create separate widgets per agent, or compare them side-by-side in the same chart.
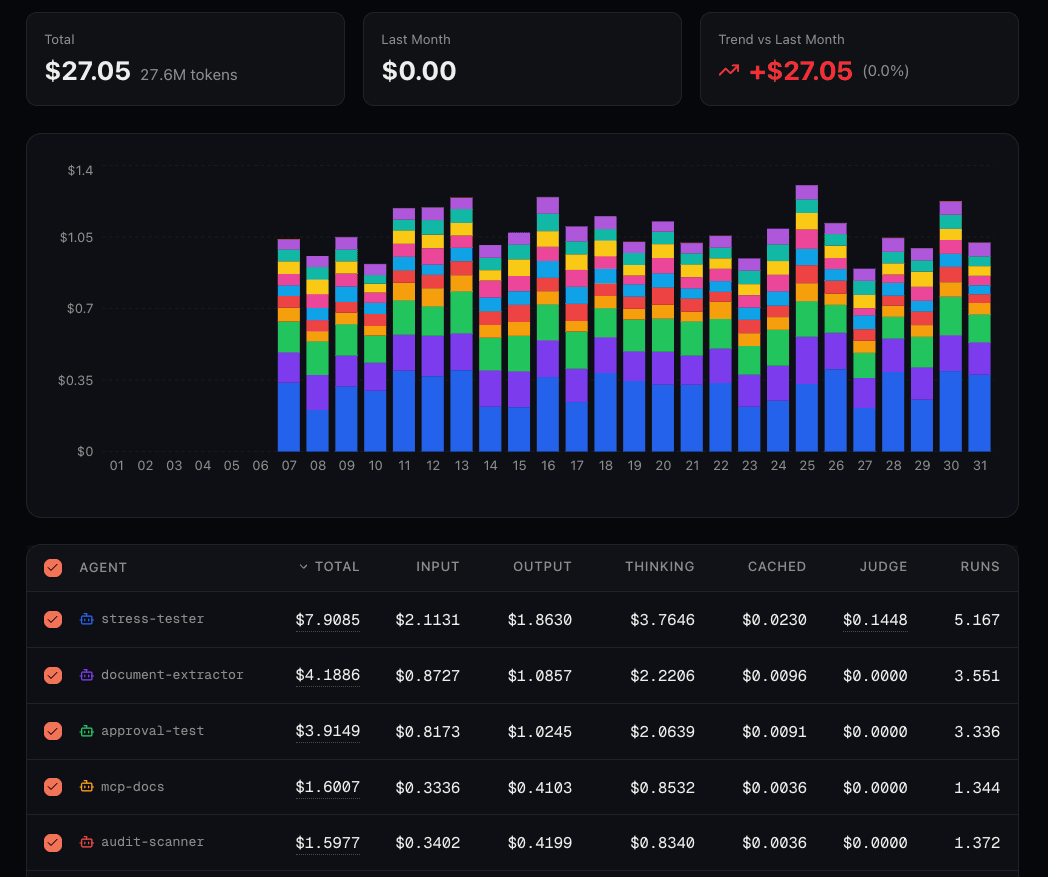
Understanding Token Economics
Token usage drives your LLM costs, but not all tokens are equal:
Output tokens typically cost 3–8x more than input tokens across major providers — for example, review OpenAI's current API pricing for up-to-date ratios across their model tiers. If your costs look high, check output usage first. Long, verbose responses are usually the culprit.
Setting Up Model Pricing
Token counts are useful, but dollar amounts are actionable. To convert tokens to costs, configure pricing for the models your agents use.
Global Defaults
Connic includes global pricing for popular models out of the box. These appear with a "global" badge in your pricing settings, so you don't need to configure anything to track costs for common models like GPT, Claude Sonnet, or Gemini.
Custom Model Pricing
Using a fine-tuned model, self-hosting, or just need different pricing than the defaults? Navigate to Settings > Observability and click Add Pricing.
# Exact model match
openai/gpt-5-mini
anthropic/claude-haiku-4-5
gemini/gemini-2.5-flash

# Regex pattern for model families
openai/gpt-5.*          # Matches all GPT-5 variants
anthropic/claude-.*      # All Claude models
gemini/gemini-.*         # All Gemini models
All pricing is per 1 million tokens. Project-level pricing overrides global defaults, so you can customize costs for specific use cases without affecting other projects.
Volume-Based Pricing Tiers
Some providers offer tiered pricing for high-volume usage. Configure volume tiers to accurately track costs when your token counts exceed certain thresholds:
Multi-Dashboard Workflows
One dashboard rarely fits all needs. Create multiple dashboards for different perspectives:
- -Executive Overview: High-level cost and success metrics for weekly reviews
- -Debugging Dashboard: Recent runs, failure rates, and logs for on-call engineers
- -Cost Optimization: Token breakdowns and cost trends for budget planning
- -Agent Comparison: Side-by-side metrics for A/B testing different agent configurations
Set a default dashboard that loads on entry, and configure a default time range per dashboard. Your executive overview might default to 30 days while the debugging dashboard shows the last hour.
Real-Time Monitoring
Dashboards auto-refresh every 10 seconds, and a "Last updated" indicator shows how fresh the data is. For incident response, you can watch failures happen live without hitting refresh.
Common Patterns and Anti-Patterns
Getting Started
Observability is available in all Connic projects. To start:
- 1.Deploy an agent and run a few requests to generate data
- 2.Navigate to Observability in your project
- 3.Review the default dashboard, then customize for your needs
- 4.Configure model pricing in Settings > Observability for accurate cost tracking
Running agents without observability is like driving without a dashboard. You might get where you're going, but you won't know you're out of gas until it's too late.
Observability tells you what your agents did and what it cost. To measure whether the output was actually good, pair it with automated agent scoring: an LLM judge grades every run against your own criteria and tracks quality trends over time.
Check out the quickstart guide to deploy your first agent, or explore the agent documentation to learn about advanced configurations.